
Welcome: test a trading idea before it costs you money
In about 15 minutes you will build a complete crypto strategy, run it on past prices, and read the result. No code is involved: you click parts of a sentence until it says what you mean. A backtest answers one question: if I had traded this exact rule over this period, what would have happened? The engine replays history candle by candle, opens and closes trades by your rules, and charges realistic fees and slippage along the way. This guide follows one worked example from start to finish, a moving-average crossover with an RSI filter on BTCUSDT.P at 15 minutes. It loses a little money on purpose. Working out why is the most useful lesson in the guide.What you will learn
1. Find your way around the workspace. 2. Choose a market, a timeframe and a test period. 3. Set your capital, order size, fees and slippage. 4. Build entry and exit rules for long and short trades. 5. Add a target, a stop loss and a trailing stop. 6. Run the backtest and read every number it gives you. 7. Improve the strategy without fooling yourself.Before you start
• You need a Mirror pip account and the Backtest Engine open in a desktop browser. • You do not need to connect an exchange API key or deposit funds. A backtest places no real orders. • Screenshots use sample data. Your prices, dates and results will differ. A backtest shows how a rule behaved in the past. It is evidence, not a promise, and nothing in this guide is financial advice.A two-minute tour of the workspace
Everything lives on one page that you read top to bottom: the chart, then your money settings, then your rules, then the Run button.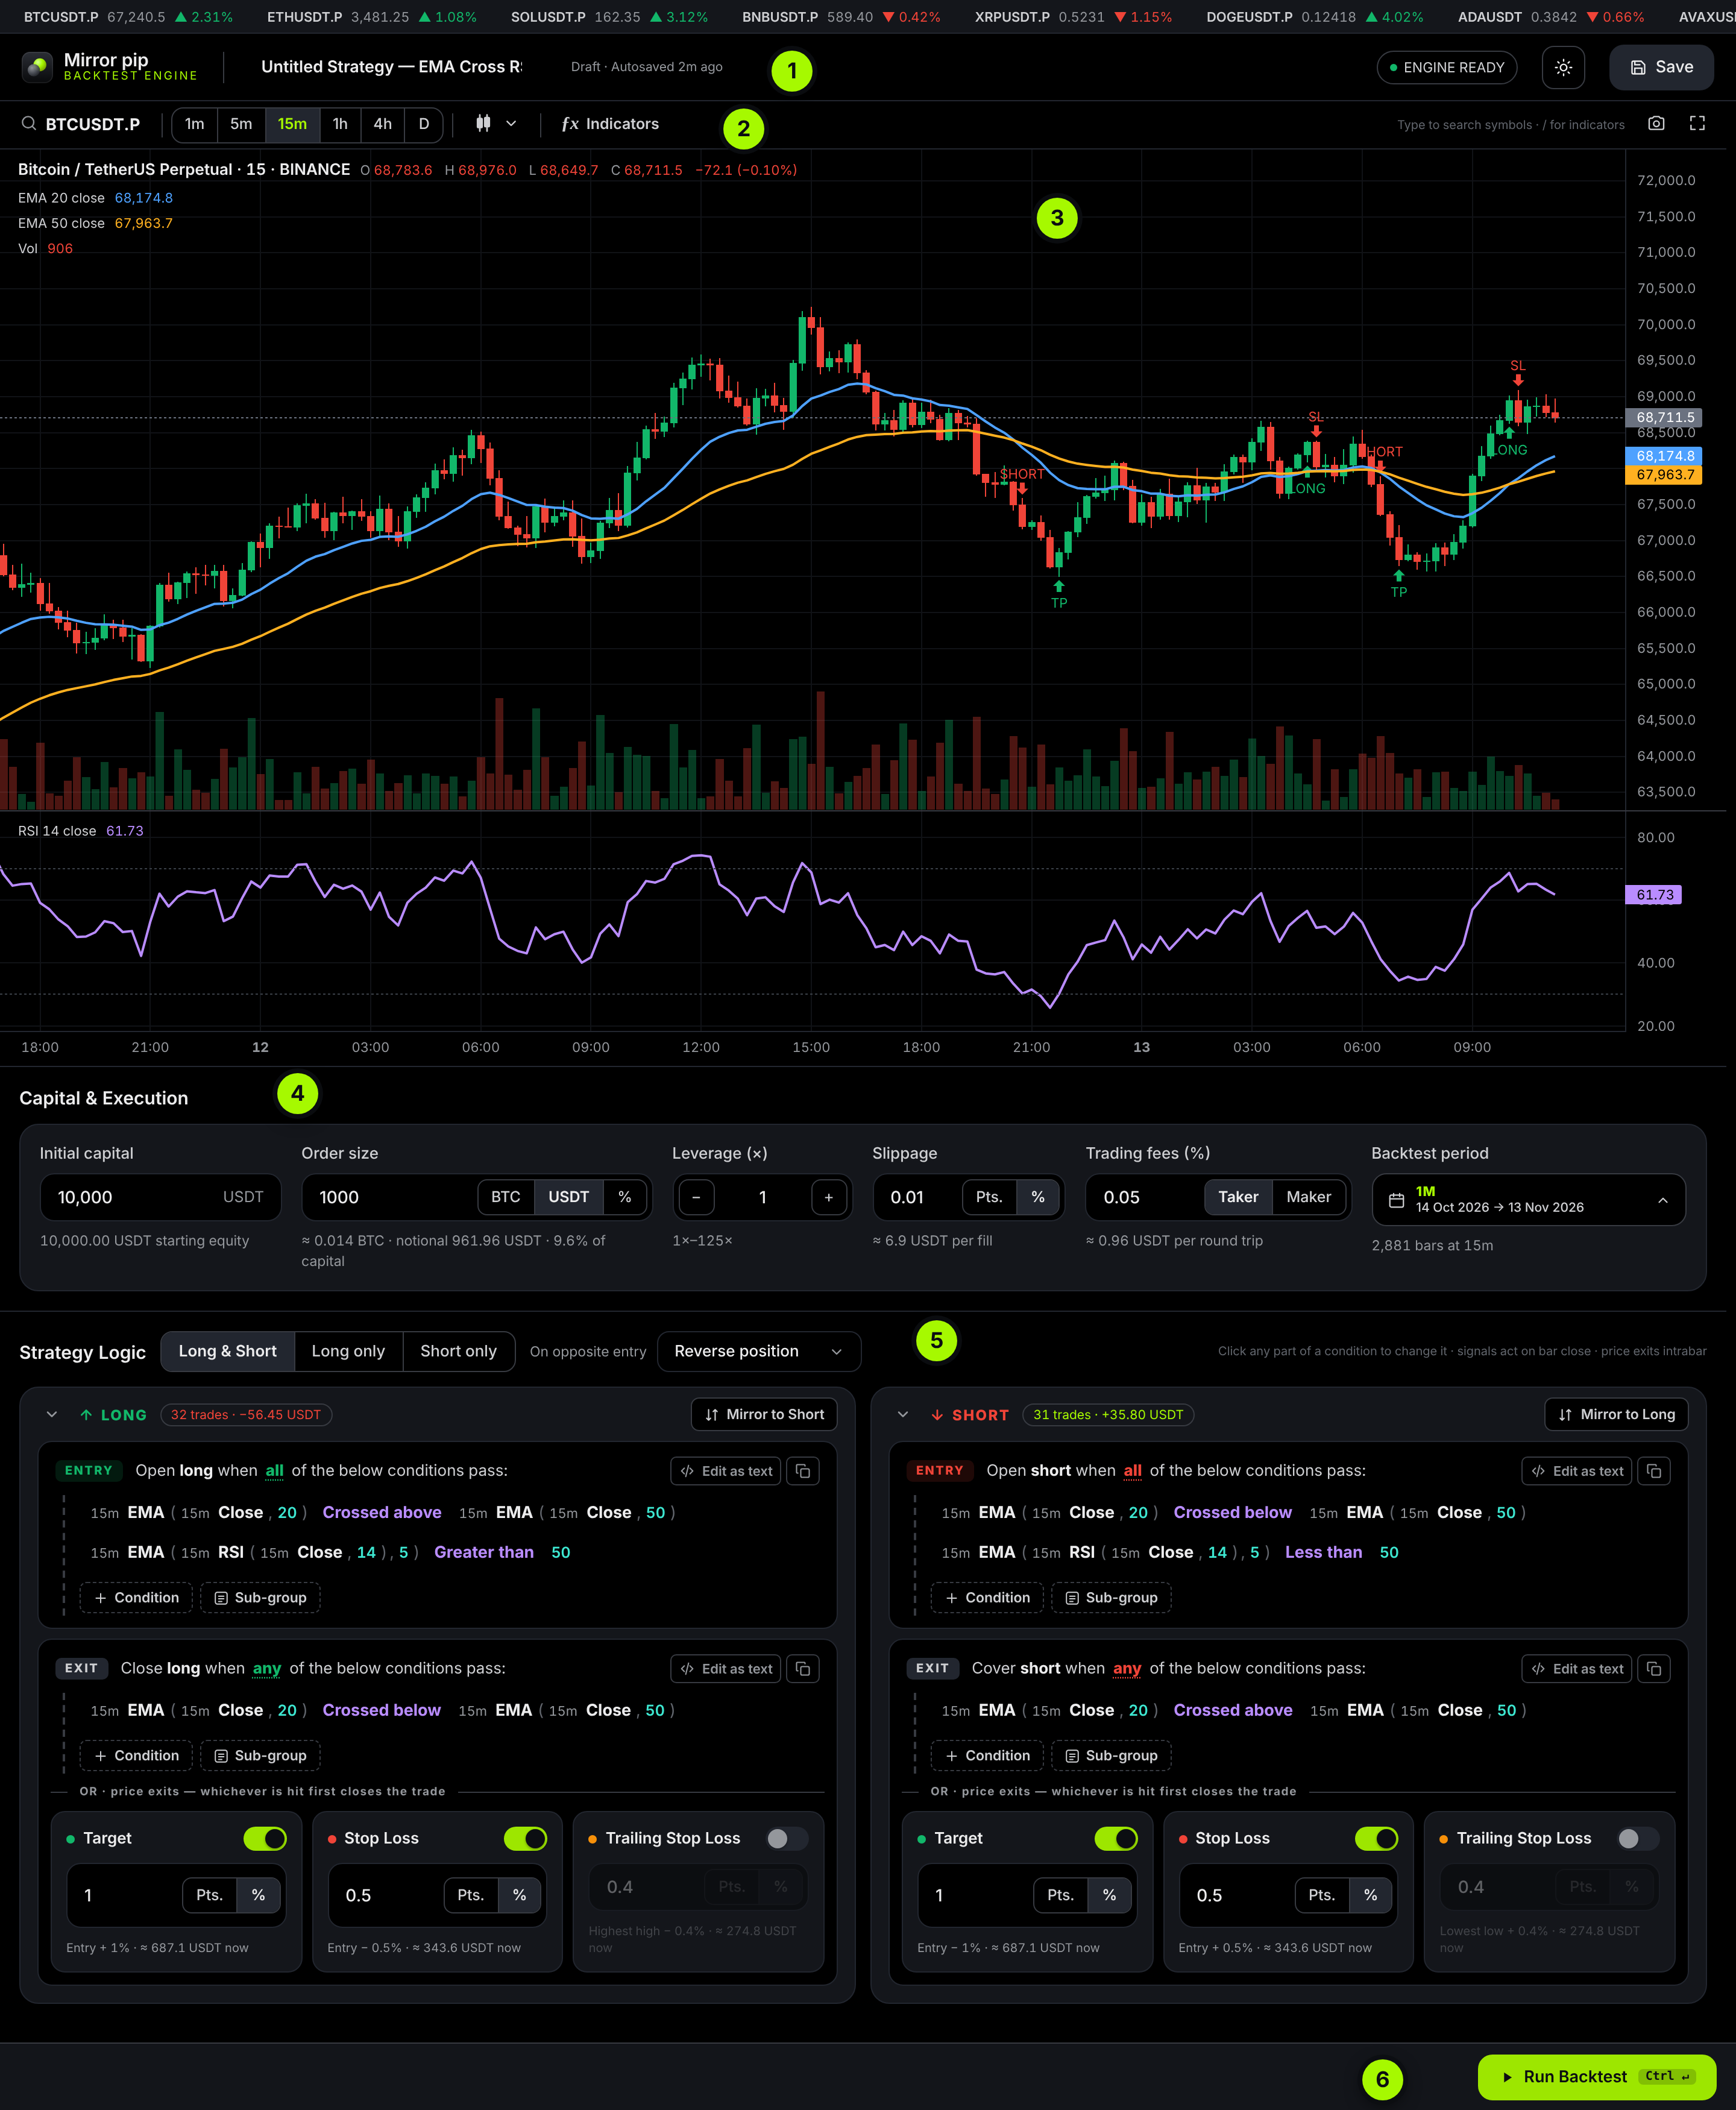
A seventh area, the Strategy Tester, slides up from the bottom after your first run. It holds your results.
Shortcuts worth learning on day one
Step 1: Choose what to test, and with how much
Four choices frame every backtest: the market, the timeframe, the period, and the money. Set them once before you touch the rules.Pick a market
1. Click the symbol button at the left of the chart toolbar, or just start typing on the chart. 2. Type a coin name such as BTC. Use the All, Perpetual and Spot chips to narrow the list. 3. Check the exchange shown at the right of each row, then click the row or press Enter.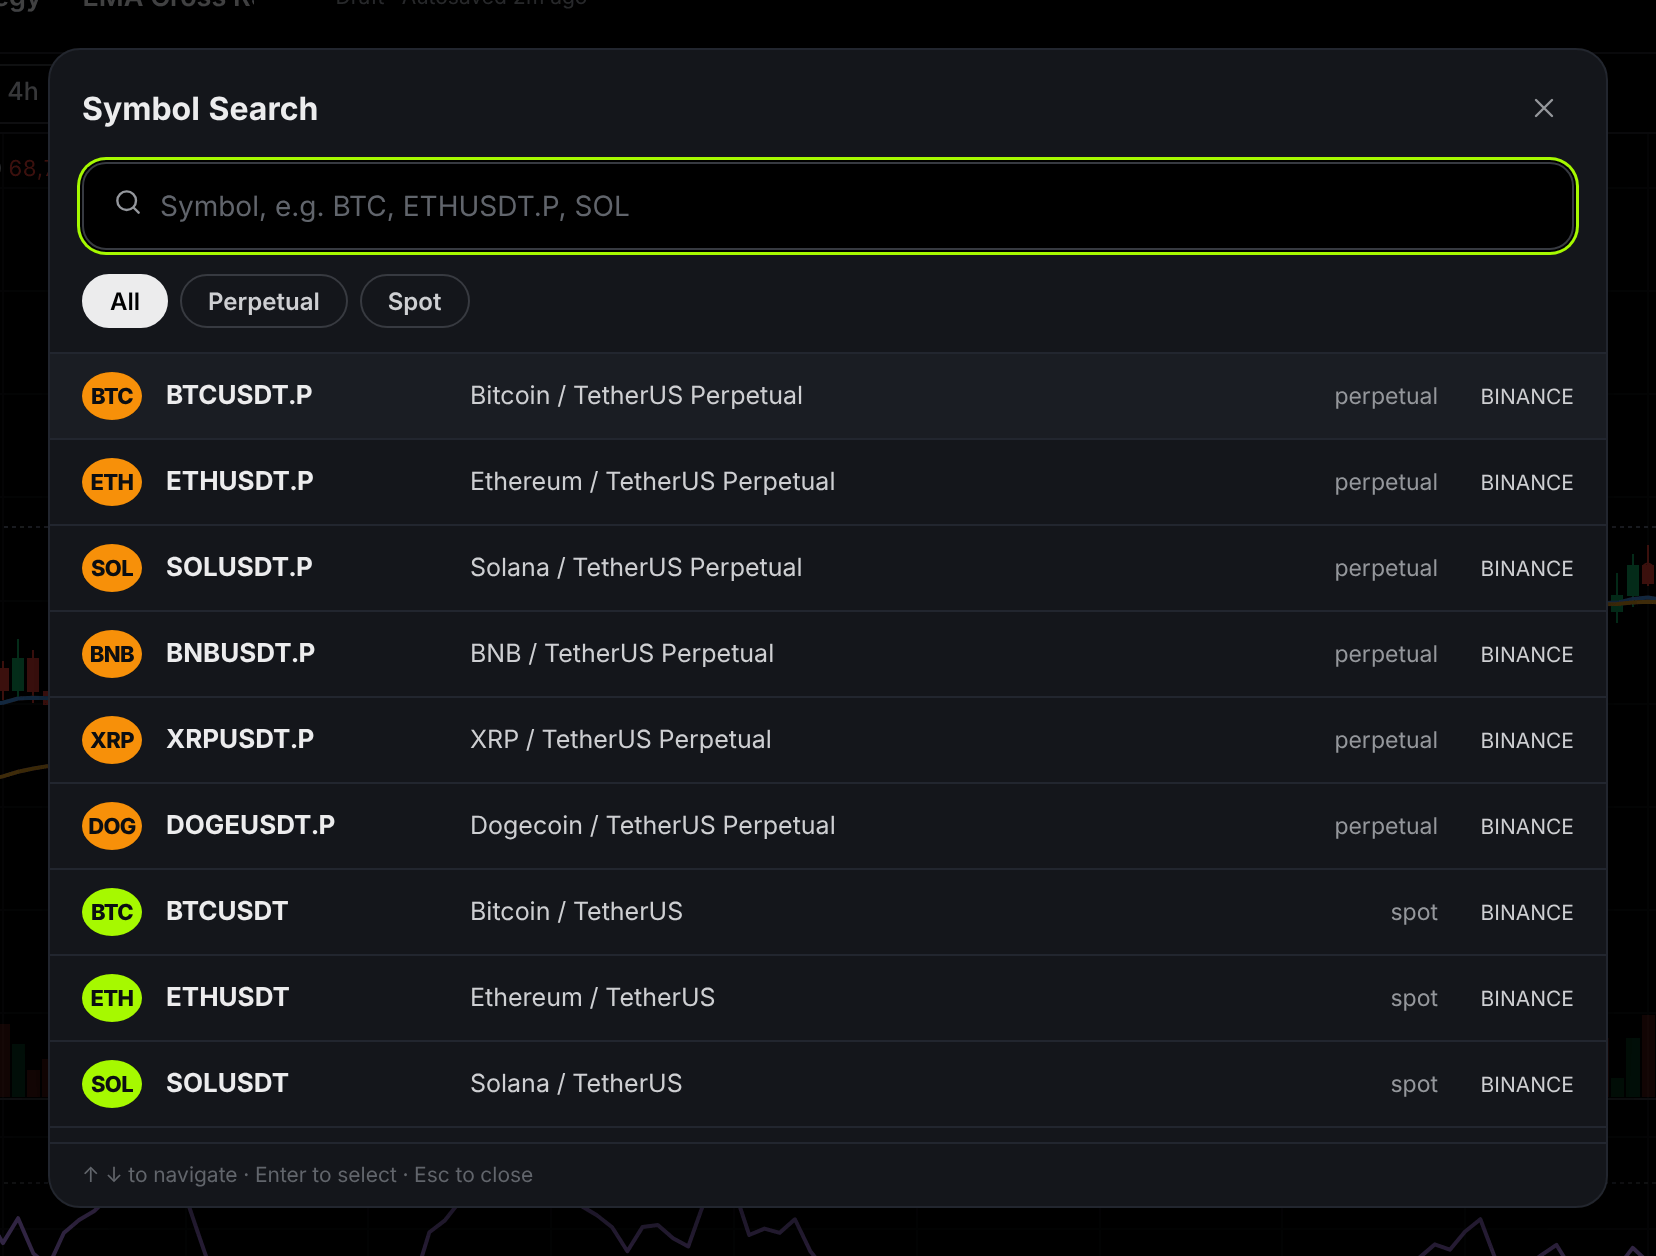
Pick a timeframe
The timeframe is how much time one candle covers: 1m, 5m, 15m, 1h, 4h or D (one day). Click 15m for this guide.
Put indicators on the chart (optional, but helpful)
Indicators on the chart let you see what your rules are reacting to. Click Indicators or press /, then click a name to add it.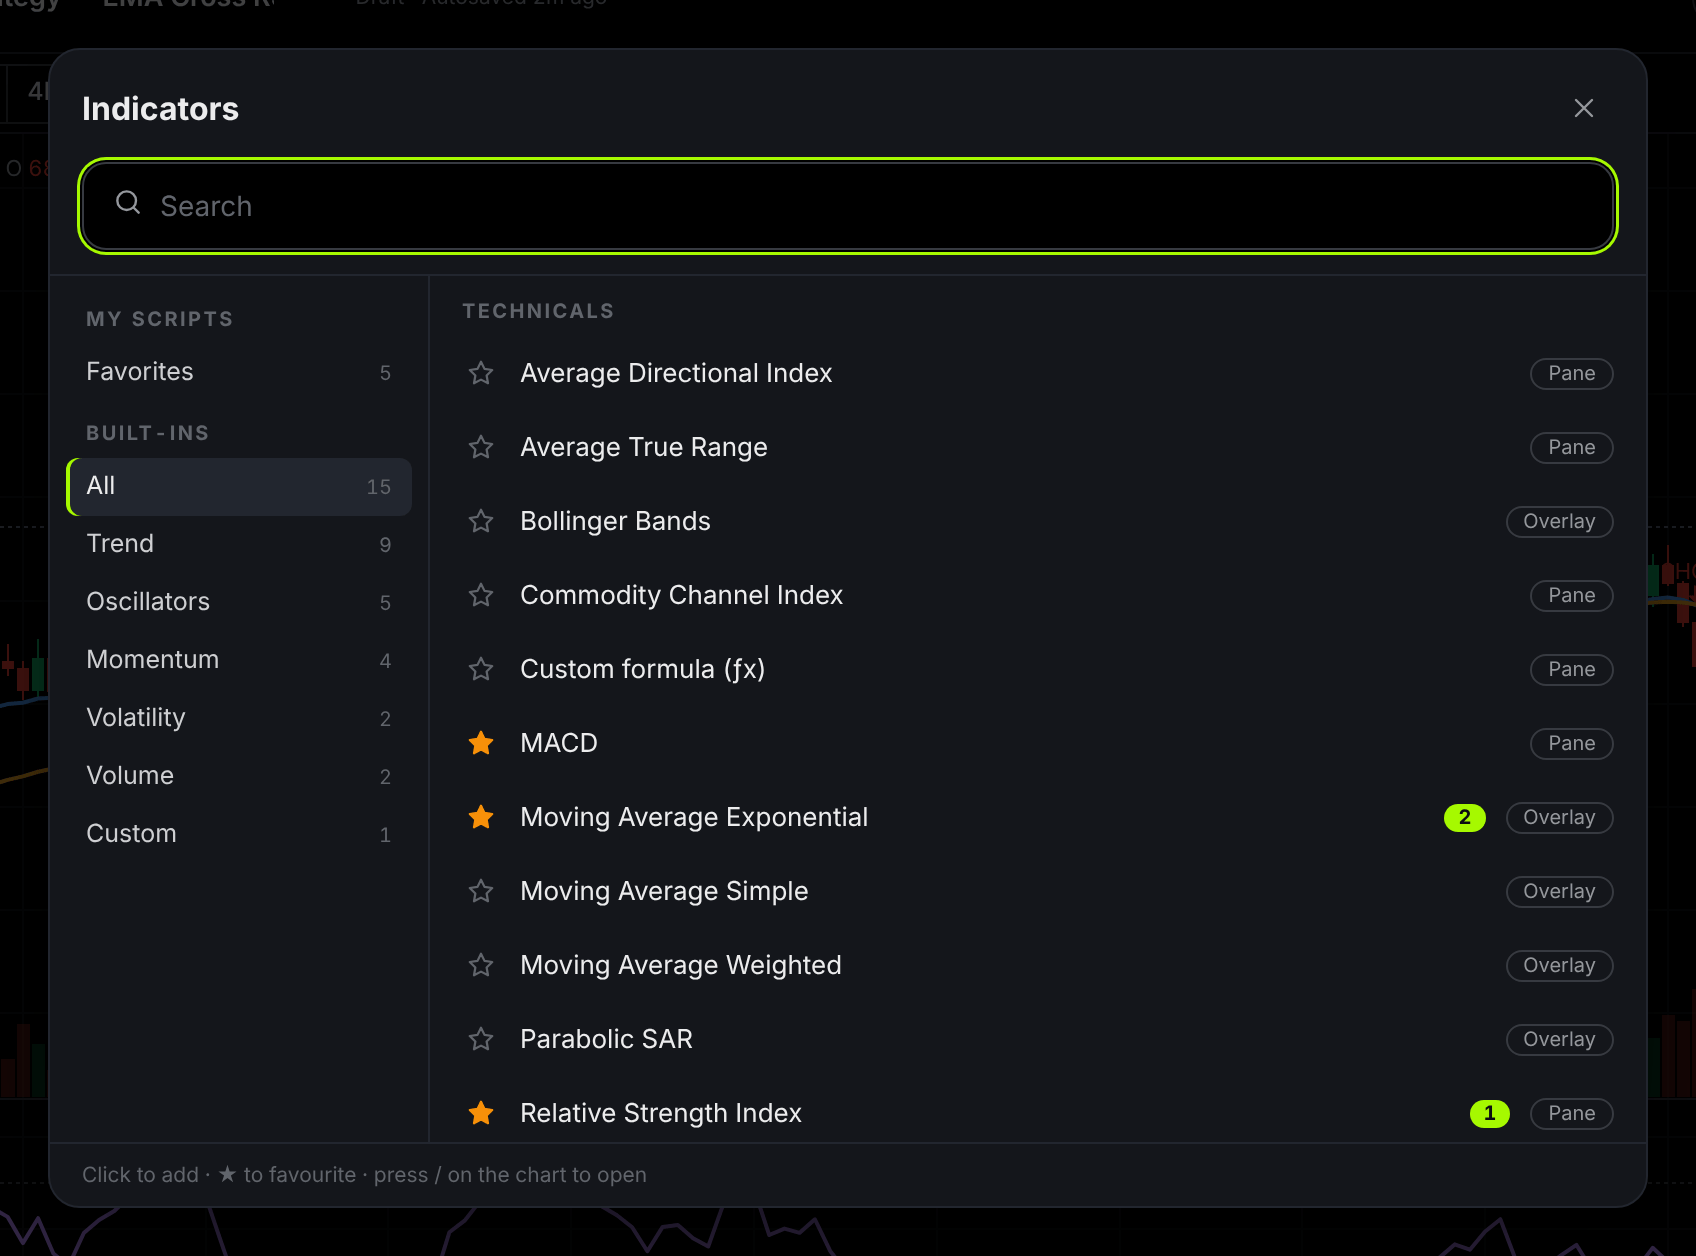
Set your capital and costs
The Capital & Execution panel tells the engine how much you start with and what each trade costs. Under every field, a grey hint shows what your number means in practice.
Three things beginners often miss:
• Start at 1× leverage. The backtest does not simulate liquidation or funding payments, so leveraged results look safer than they really are.
• Never set fees or slippage to zero. They are small per trade and large in total, as Step 5 shows.
• Watch the order size hint. If it says the size rounds to 0, or that margin exceeds capital, those entries are skipped.
Choose the backtest period
Click the Backtest period box and choose a preset from 1W to All, or enter your own From and To dates and click Apply.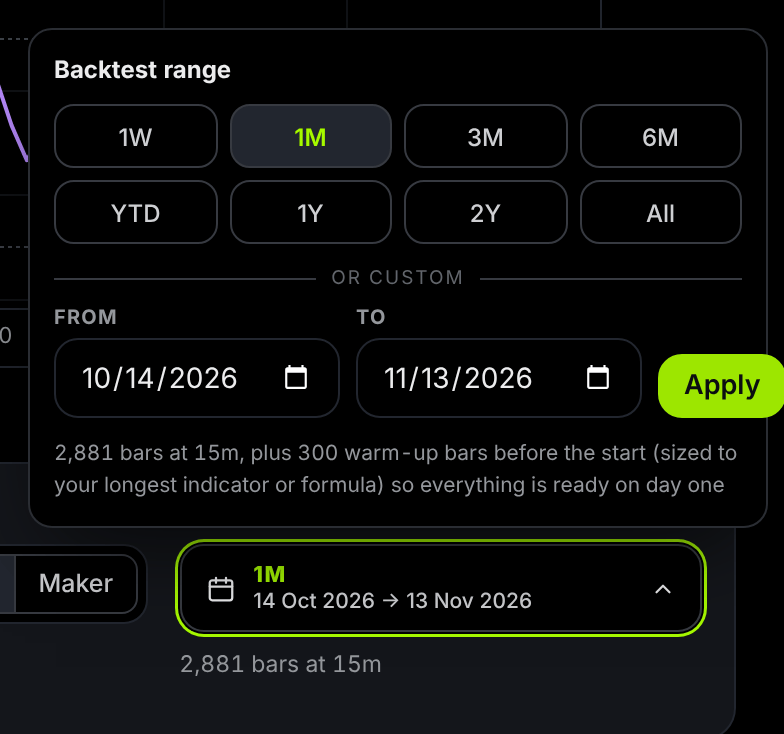
Step 2: Build your entry rules
A rule is a plain sentence, this compared with that, and you change any word in it by clicking it. That is the whole idea of the builder.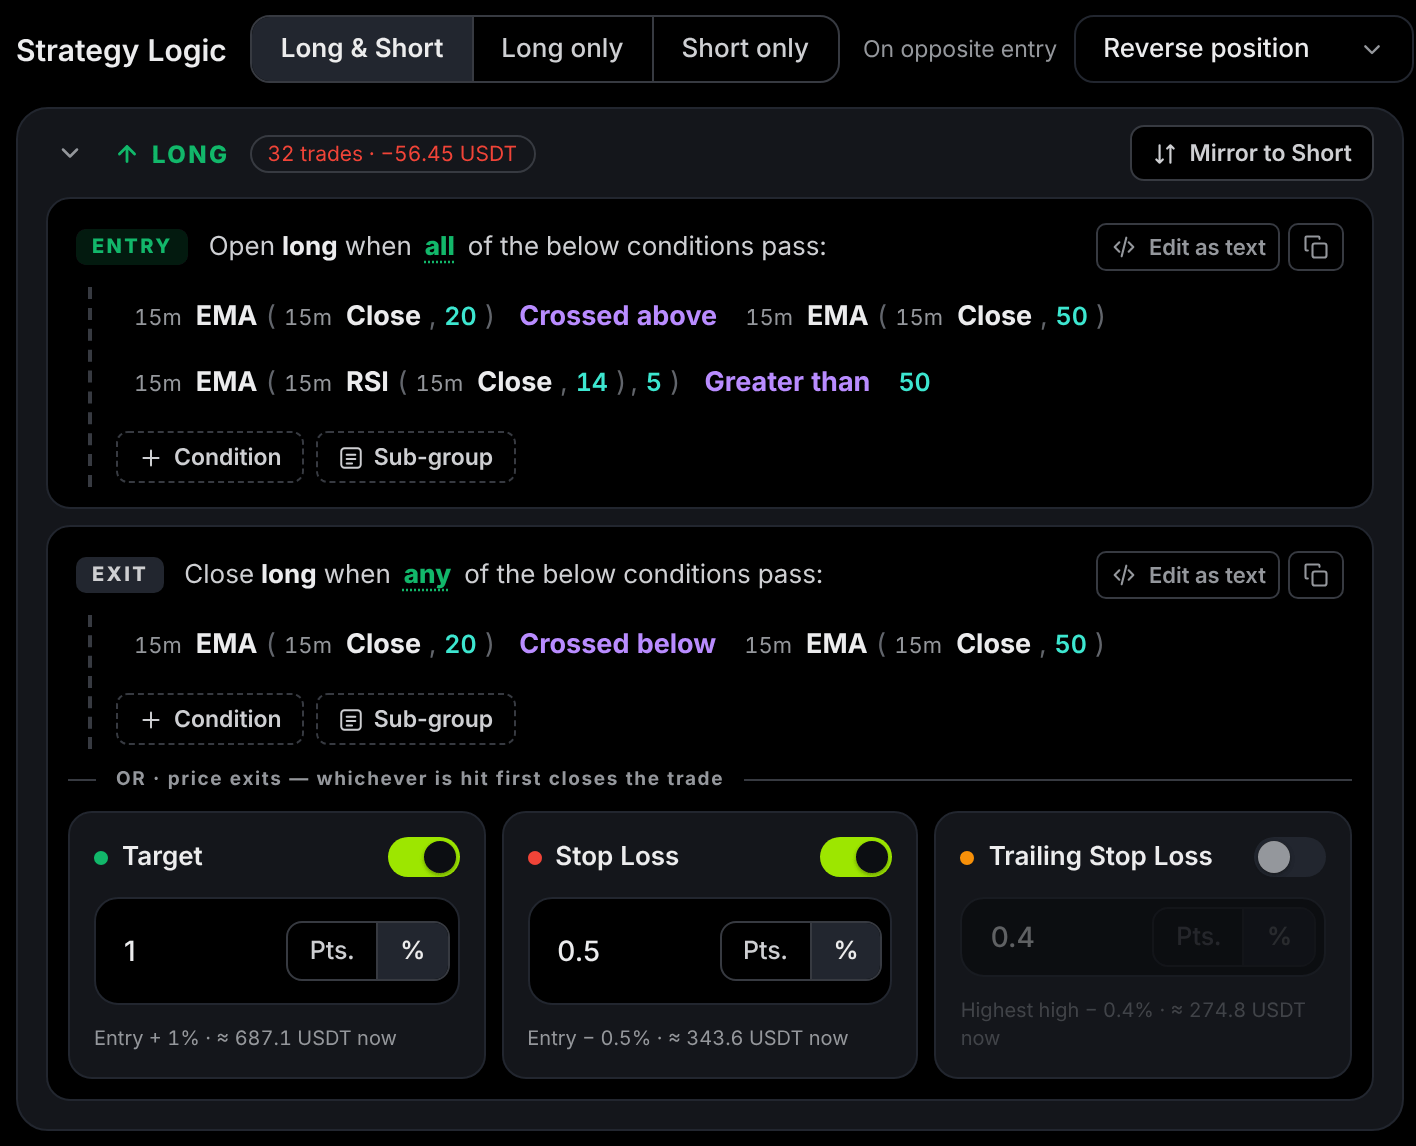
How a condition reads
Take the first line in Figure 7: EMA(Close, 20) Crossed above EMA(Close, 50).
In plain English: open a trade when the fast average climbs through the slow average. That is a classic sign that a trend may be starting.
Build the example entry
First choose which directions to trade. At the top of Strategy Logic, pick Long & Short, Long only or Short only. Leave it on Long & Short. Now build the Long entry: 1. In the LONG column, under ENTRY, click + Condition. A starter line appears: Close Crossed above EMA(Close, 20). 2. Click Close on the left side and choose EMA from the list. The left side becomes EMA(Close, 20). 3. Click the teal 20 on the right side, type 50, and click Set. 4. Click + Condition again for the second line. 5. Click its left Close and choose RSI. It becomes RSI(Close, 14). 6. Click RSI, click Wrap in… at the bottom of the list, and choose EMA. Change the new length to 5. This smooths the RSI so it flickers less. 7. Click the purple comparison and choose Greater than. 8. Click EMA on the right side and choose Number at the bottom of the list. It starts at 50, which is what you want.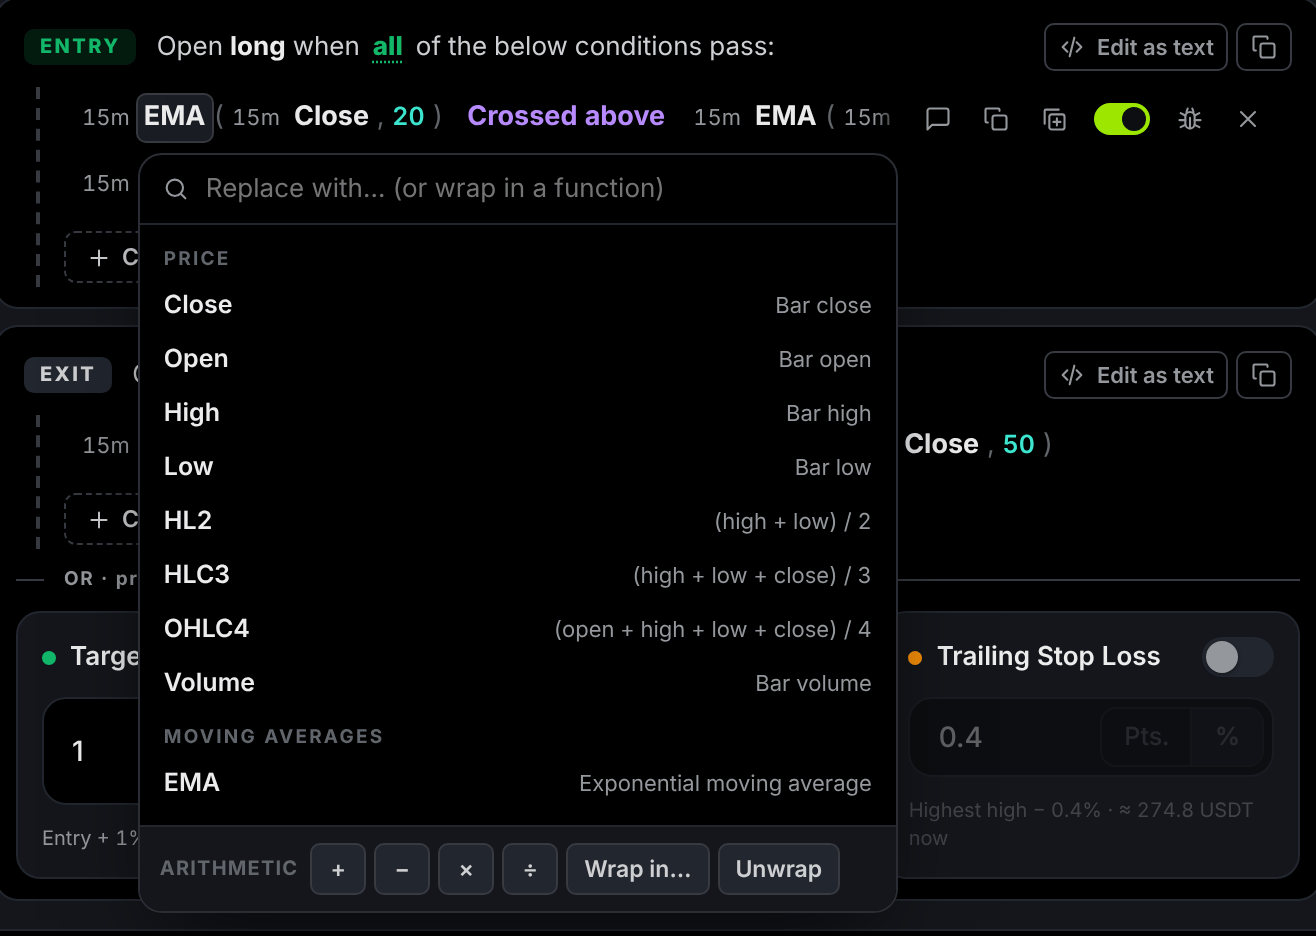
All or any
The heading of each block reads “Open long when all of the below conditions pass”. Click all to switch it to any. • all means every line must be true on the same candle. Use it to add filters. • any means one true line is enough. Use it for alternative triggers. Need both at once, such as A and (B or C)? Click Sub-group. A group has its own all or any switch, and groups can sit inside groups.Check that a condition really fires
Hover a line and click the bug icon. The engine tells you how many candles in your period pass that condition, and its values on the latest candle.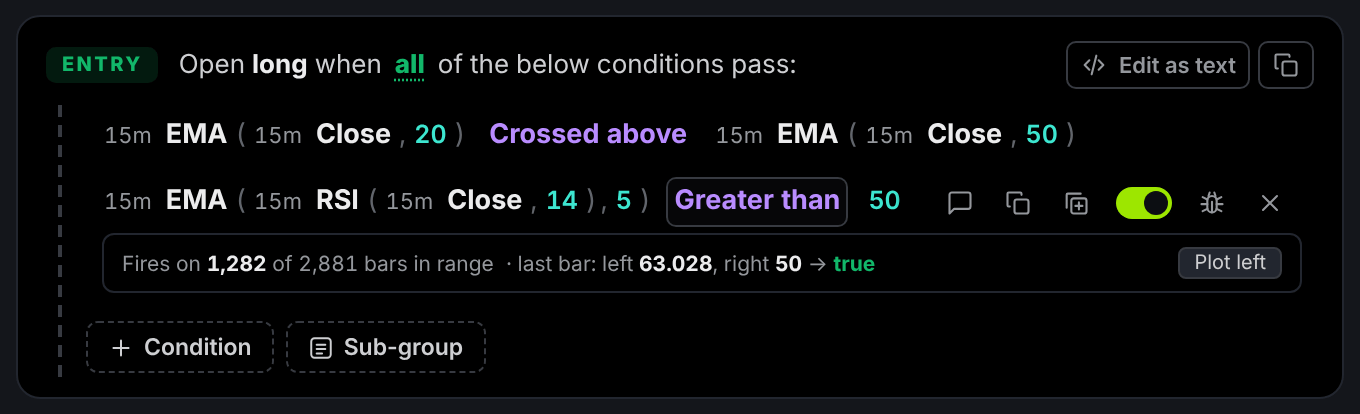
Copy your rules to the Short side
Click Mirror to Short at the top of the Long column. The engine copies your Long rules and flips them: Crossed above becomes Crossed below, Greater than becomes Less than. Then choose what happens when a Short entry appears while a Long trade is open, using On opposite entry:Prefer typing? Use Edit as text
Click Edit as text on any block to see the same rules as one line. Edit it, then click Apply or press Ctrl + Enter.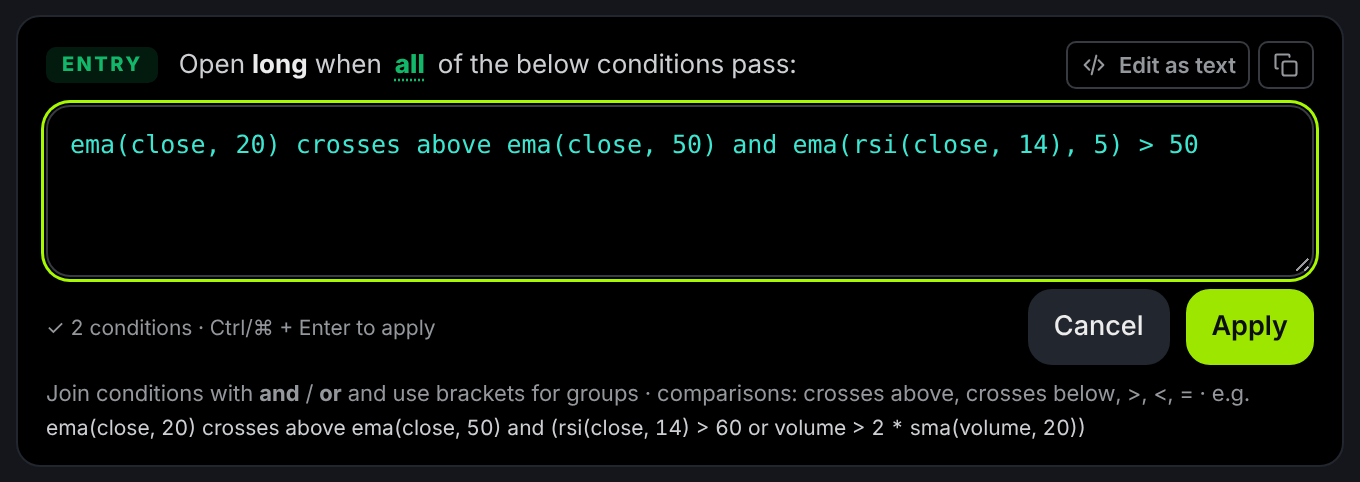
Step 3: Decide how trades end
Every trade needs a way out, and the engine gives you two kinds: a signal exit that follows your rules, and price exits that protect the trade. Whichever is hit first closes it.Signal exit
The EXIT block works exactly like the Entry block, with one difference: it starts on any, so a single true line closes the trade. For the example, add one condition under LONG → EXIT: EMA(Close, 20) Crossed below EMA(Close, 50). The trend that got you in has turned, so you leave.Price exits: Target, Stop Loss, Trailing Stop Loss
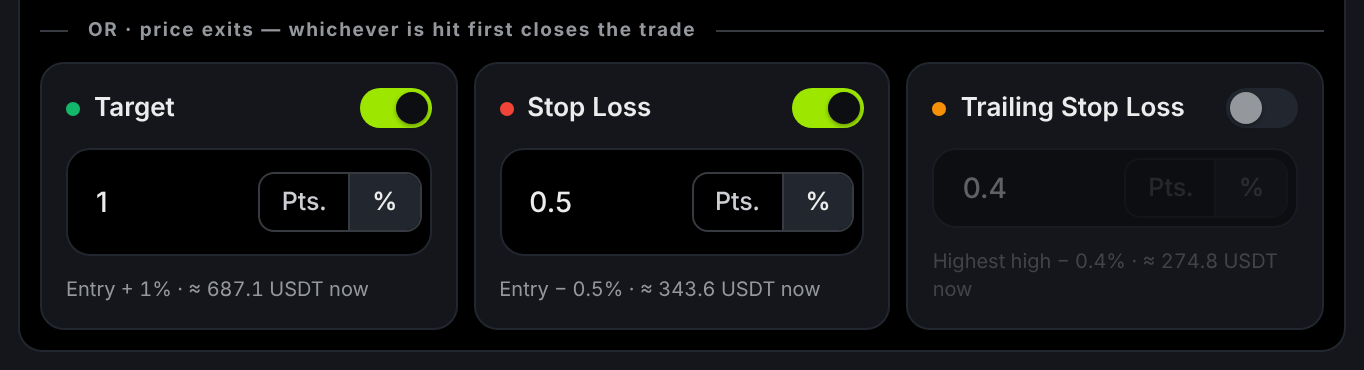
The grey line under each box converts your setting into a USDT price distance at the current price. Use it as a sanity check: a stop that is only a few dollars from entry on BTC will be hit by ordinary noise.
A 1% target with a 0.5% stop risks 1 to make 2. A strategy like that can be right less than half the time and still profit, as long as costs stay small.
How the engine fills your exits
These rules are deliberately cautious, so the backtest does not flatter you. • Entries and signal exits happen at the close of a candle. A condition must be true when the candle finishes. • Price exits are checked inside every candle after the entry candle, using its high and low. • If one candle touches both your stop and your target, the stop wins. The engine cannot know which came first, so it assumes the worse one. • If price jumps past your level between candles, you are filled at the candle’s open, not at the level you hoped for. • One trade at a time. A new entry signal is ignored while a trade on the same side is open. • If Long and Short entries fire on the same candle, neither is taken.Step 4: Run the backtest
Click Run Backtest at the bottom right, or press Ctrl + Enter. Results appear in a second or two.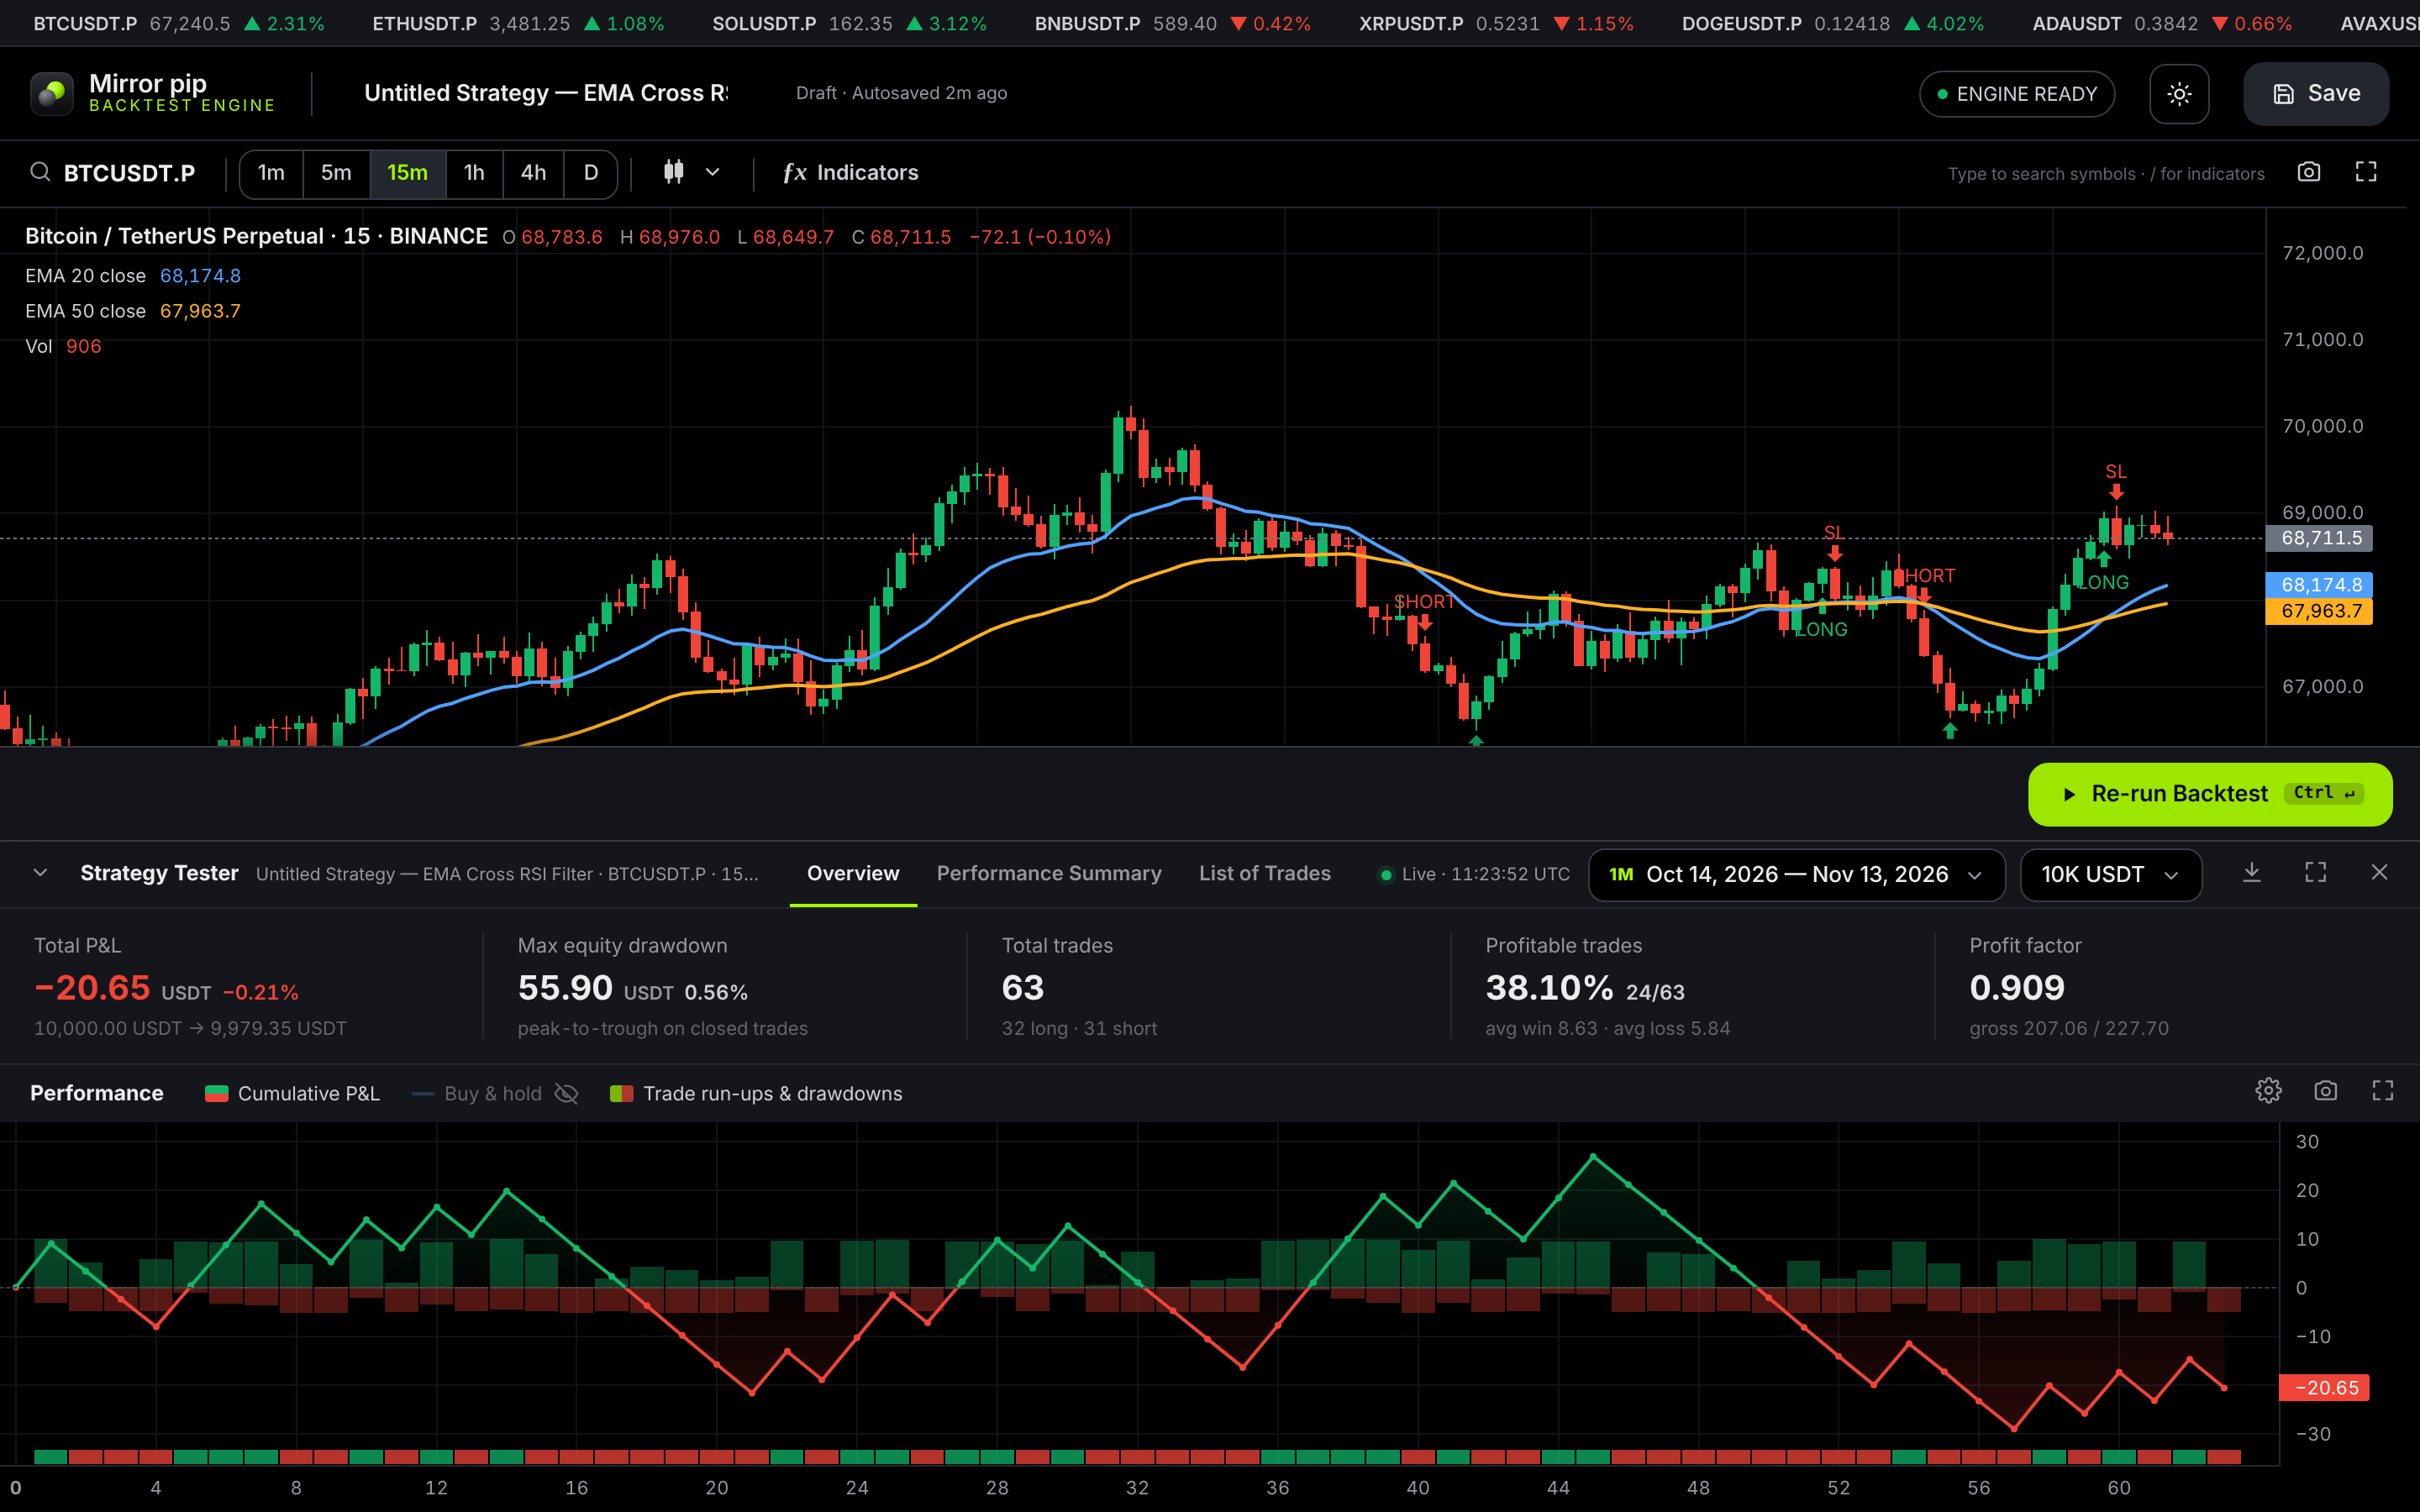
After the first run, results update live as you edit. Change a length or a stop and the numbers follow at once, so you rarely need to press Run again.
If the Run button will not work
The engine explains the problem in the bar next to the button.Step 5: Read your results
The Strategy Tester has three tabs, and they answer three questions in order: did it work, why, and what exactly happened? Use the icons at the right of its header to export trades as CSV, maximize the panel, or close it. The date and capital chips let you change the period and starting balance without scrolling up.Overview: did it work?
Figure 13. The Overview tab: five headline numbers above the performance chart. The example strategy lost 20.65 USDT over one month. Here is how to read each headline number.
Win rate means nothing by itself. Here the average win is 8.63 USDT and the average loss is 5.84 USDT. With that ratio, the strategy breaks even at about a 40% win rate. It managed 38.10%, so it lost slightly.
The performance chart shows the same story as a picture:
• The Cumulative P&L line is your running profit, trade by trade. You want a steady climb, not one lucky spike.
• The run-up and drawdown bars show how far each trade went for you and against you while it was open.
• Click Buy & hold in the legend to compare against simply holding the coin.
• Hover any point for trade details. Click it to jump to that trade on the price chart.
• The gear icon switches the bottom axis between trade number and exit time.
Performance Summary: why?
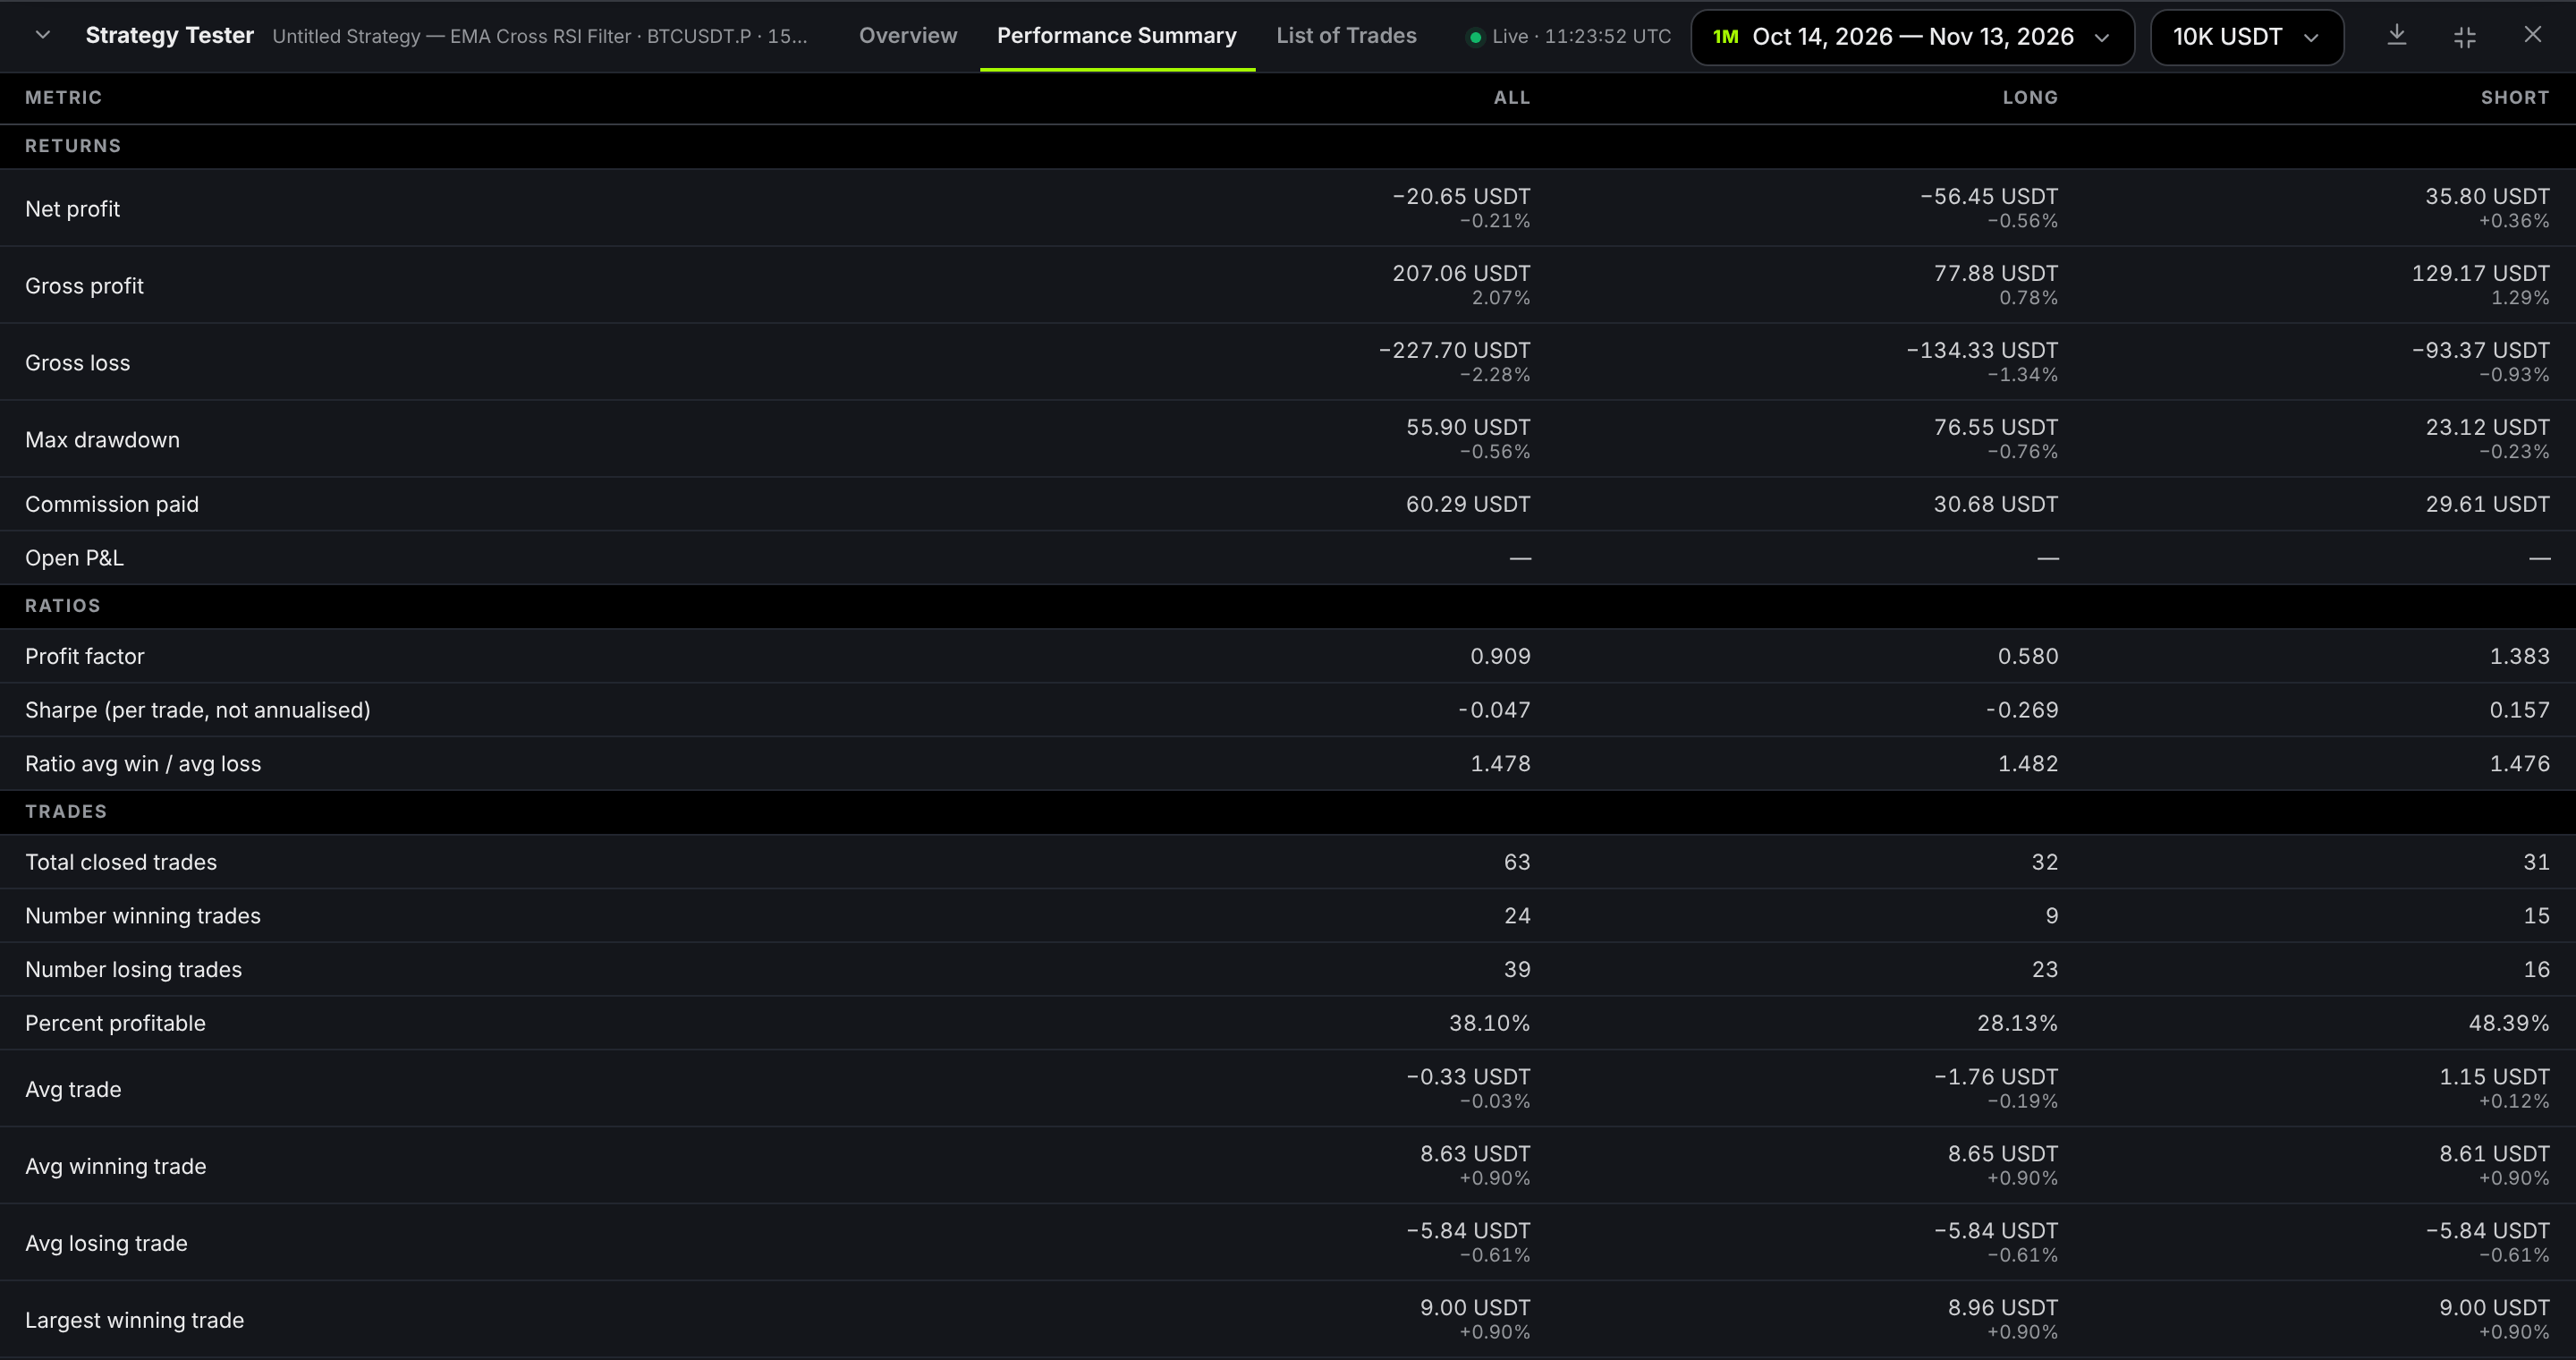
Two findings jump out:
1. The Short side made money and the Long side lost it. In this period the long entries were the problem, not the whole idea.
2. Fees decided the result. The strategy paid 60.29 USDT in commission and lost 20.65 USDT. Before fees it was ahead by 39.64 USDT.
The second finding is why you should never test with fees set to zero. Sixty-three trades in a month is a lot of commission for an edge this thin.
Further down, Time in trade shows how long trades last. Here winners lasted about 5 candles and losers about 3, which tells you the stop is hit quickly.
List of Trades: what exactly happened?
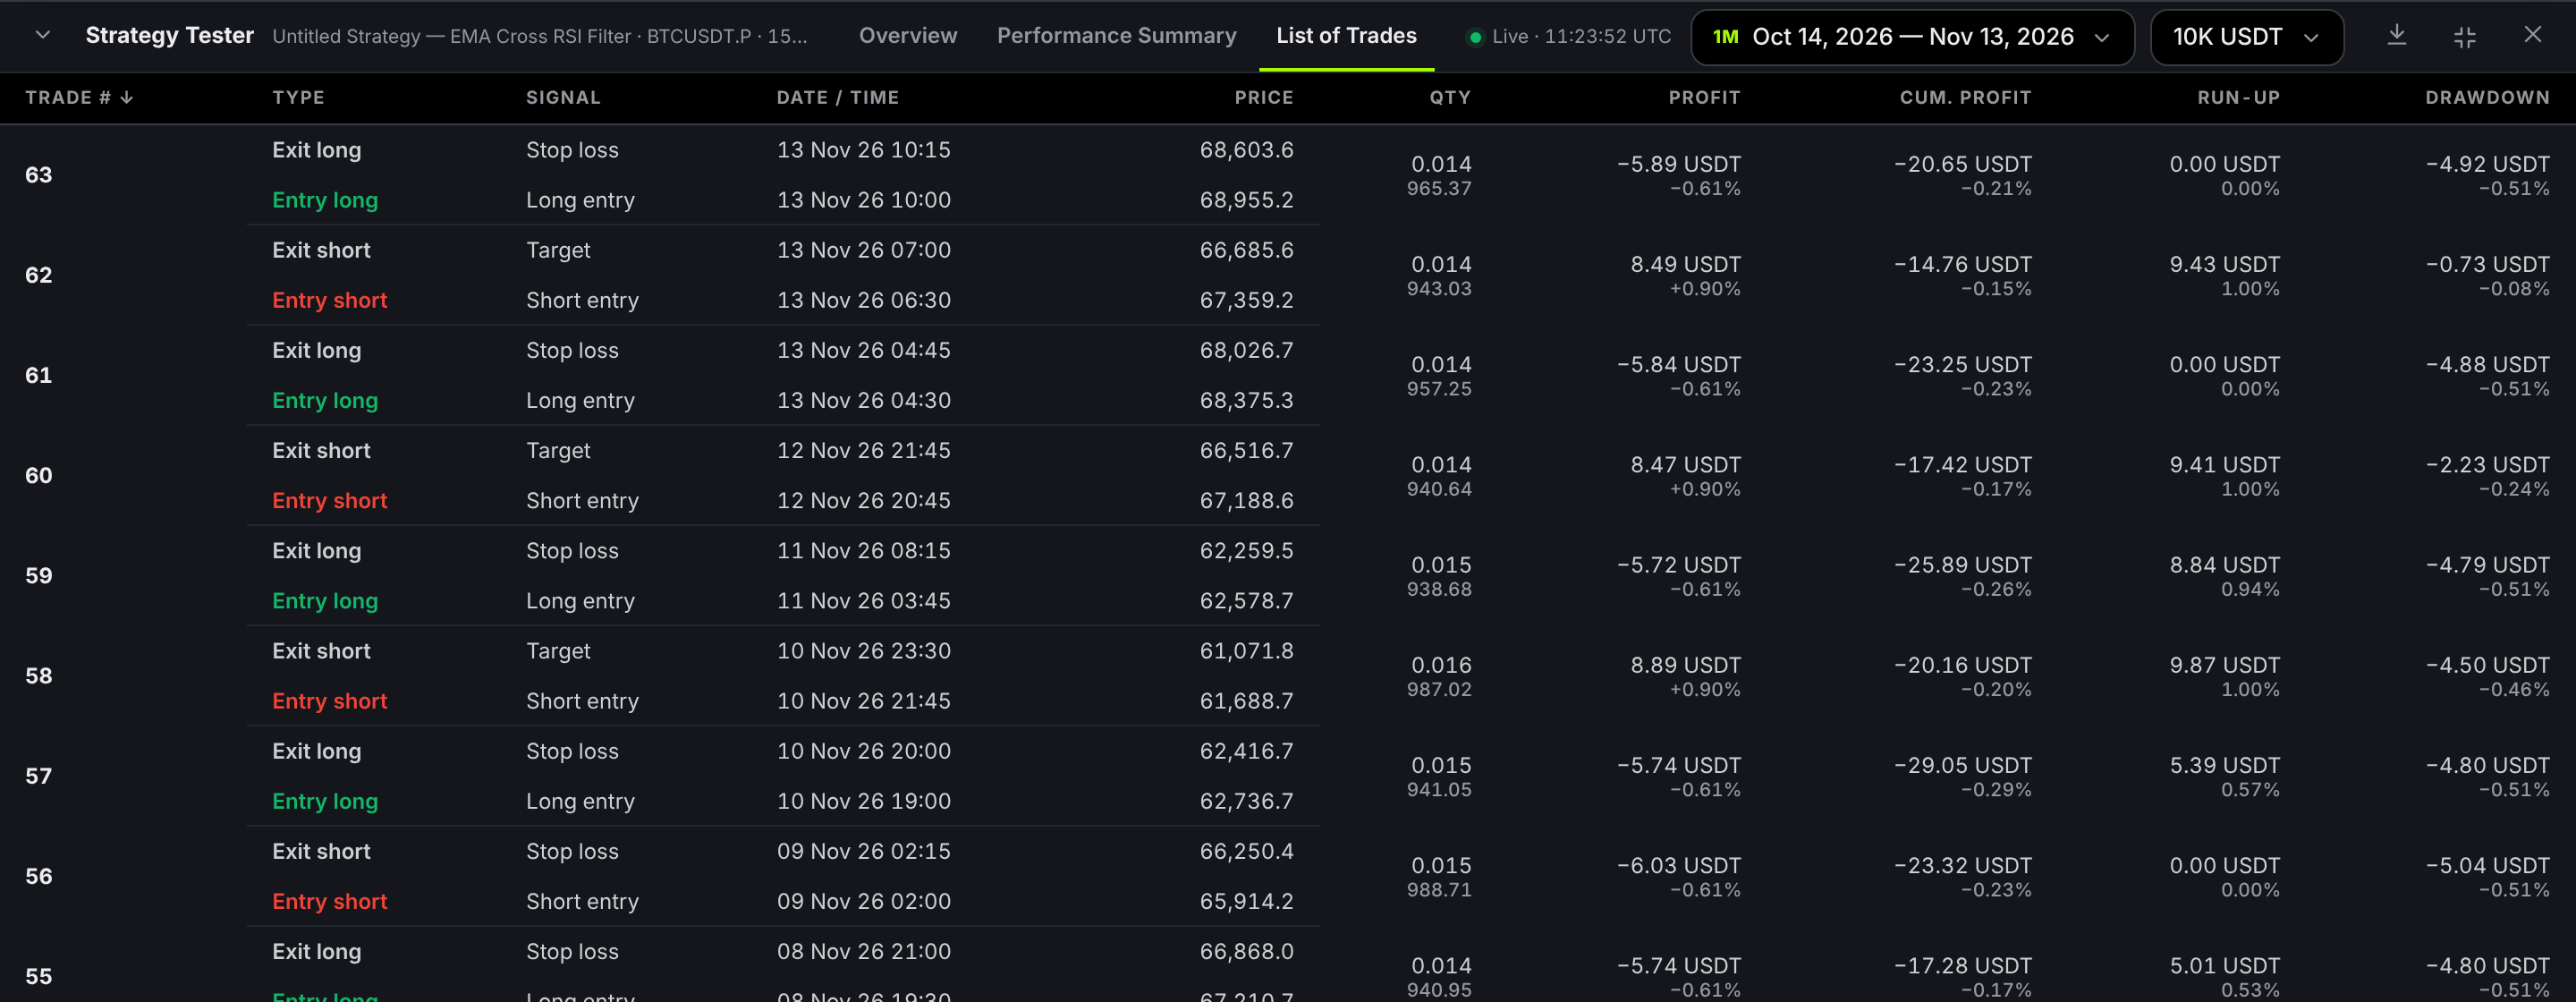
Click the Trade # header to flip between newest first and oldest first. Then look for patterns: trades with a healthy run-up that still ended at the stop suggest the target is too far away, or that a trailing stop would help.
Improve the strategy without fooling yourself
Change one thing at a time, watch the numbers move, and keep only changes that hold up on data you have not tuned against. That is the whole method.Five experiments to try on the example
Results update live, so each of these takes seconds. Write down the profit factor before and after. 1. Trade one side only. Switch to Short only, then Long only. Does one side carry the strategy? 2. Move up a timeframe. Try 1h instead of 15m. Fewer trades means less commission. 3. Lengthen the period. Go from 1M to 6M or 1Y. A result that survives more market conditions is worth more. 4. Switch on the Trailing Stop Loss and switch the Target off. Does letting winners run beat a fixed target? 5. Disable the RSI filter with its on/off switch. Is the filter earning its place?A simple loop to follow
1. Form one idea in a sentence, such as “the stop is too tight”. 2. Change only that setting. 3. Compare profit factor, drawdown and trade count with the previous run. 4. Keep the change only if it helps on a longer period and on a second coin. 5. Save, and name the strategy so you can find it later.Seven beginner mistakes
A good backtest earns a strategy a small, careful live trial. It does not earn it your whole account.